What are we measuring with PitchAI?
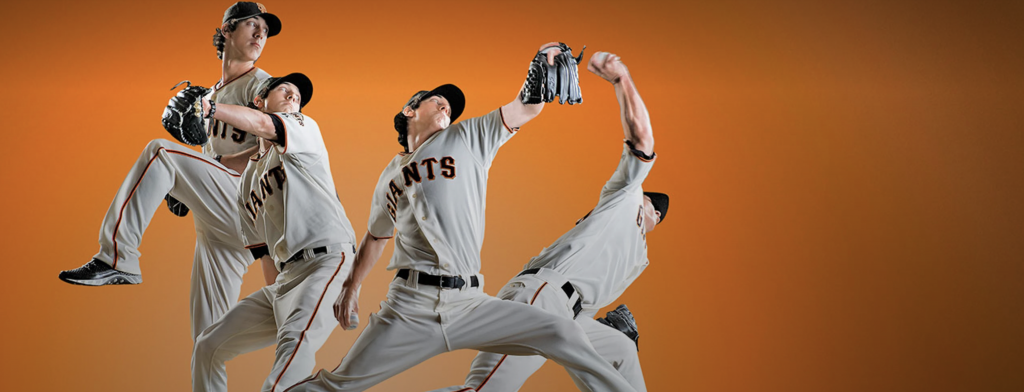
Let me take you back to when I started to get interested in the biomechanics of pitching – 2008, I just started my Master’s in Human Kinetics at the University of Windsor, and there was a Sports Illustrated article on Tim Lincecum – citing Glenn Fleisig and his breakdown of the pitching delivery. At the time, I thought this was really cool – but I was going to keep down the path of my ergonomics degree.
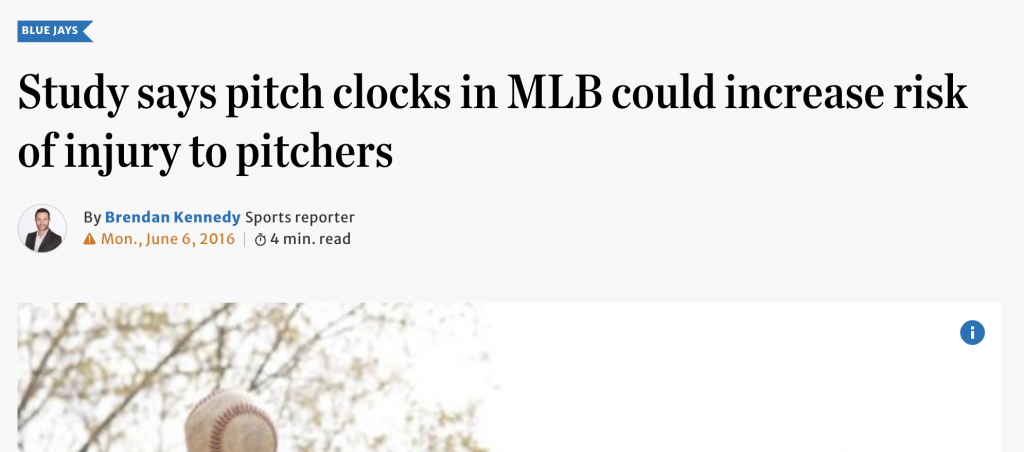
Fast forward to 2015 – I’m working on my Post Doctoral Fellowship, and I see another article – this time citing that the MLB is moving towards implementing a pitch clock. Having just completed my PhD a few months earlier, I created a model for predicting muscle fatigue. I used some data from published EMG studies, and showed you’d see a significant increase in forearm fatigue if this rule was put into place. At this point, it became clear to me there were a lot of different ways to make a difference in sports science – and peer reviewed publications were not the only method.
Thanks to people like Joshua Howsam at Baseball Prospectus Toronto, Eno Sarris at Fangraphs and eventually The Athletic, and Kyle Boddy at Driveline – I was warmly welcomed into the baseball writing community.
This was really just the start. Coming from an ergonomics background, I looked at performance and injury risk as a factor of a combination of force, posture, and repetition. This same thing could be said about baseball pitching – your Stuff/Velocity (force), Repetition (Fatigue Units), and Mechanics are all a huge part of how well you can perform, and how likely you are to become injured. The STUFF metric and Fatigue Units are widely used in baseball, but the hardest part of the equation was always capturing mechanics – though that is all about to change.
Our first attempt to measure mechanics was with Richard Birfer’s MSc thesis – coming up with a standardized approach to measuring mechanics at foot strike, we compared coaches and scout results against a motion capture system. While they were reliable – they got the same answer every time – they were only correct 50% of the time. However, the motion capture system was difficult to use – and you can’t take it on the field. Pitchers also reported they threw 5-10% slower in the lab because of the sterile environment and encumbering equipment.
Our solution? Let’s take the motion capture lab to your phone. I wrote a post on our website last month, talking about our solution PitchAI – and how it was used to be a reliable method of capturing data in the field. But – how accurate would this data be compared against the gold standard motion capture lab?
We collected data with our team at Brock University – but we also worked with our partners at Driveline Baseball to get even more paired data between cell phone video and the motion capture lab. In total, we had over 100 pitches to compare against, and close to 50 pitchers to analyze. This would be our most representative sample of how accurate PitchAI could be – which has huge implications for the use of the tool for injury prevention, performance improvement, and rehabilitation.
While more granular results will be available soon – we intend on publishing these data in a peer-reviewed journal shortly – to give you a summary of how things looked, PitchAI reports back on 15 metrics – Elbow Flexion, Shoulder Abduction, Horizontal Abduction, and External Rotation for the throwing arm and the glove arm, Trunk Twist, Trunk Flexion, and Trunk Tilt, Pelvis Twist, and the Knee Flexion of the trail leg and lead leg.
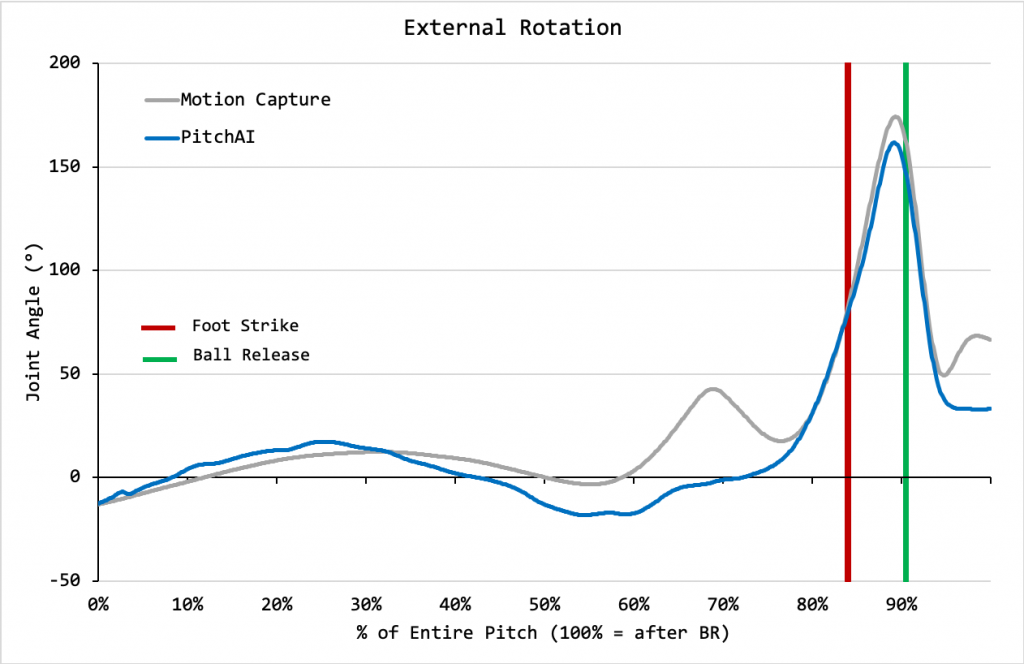
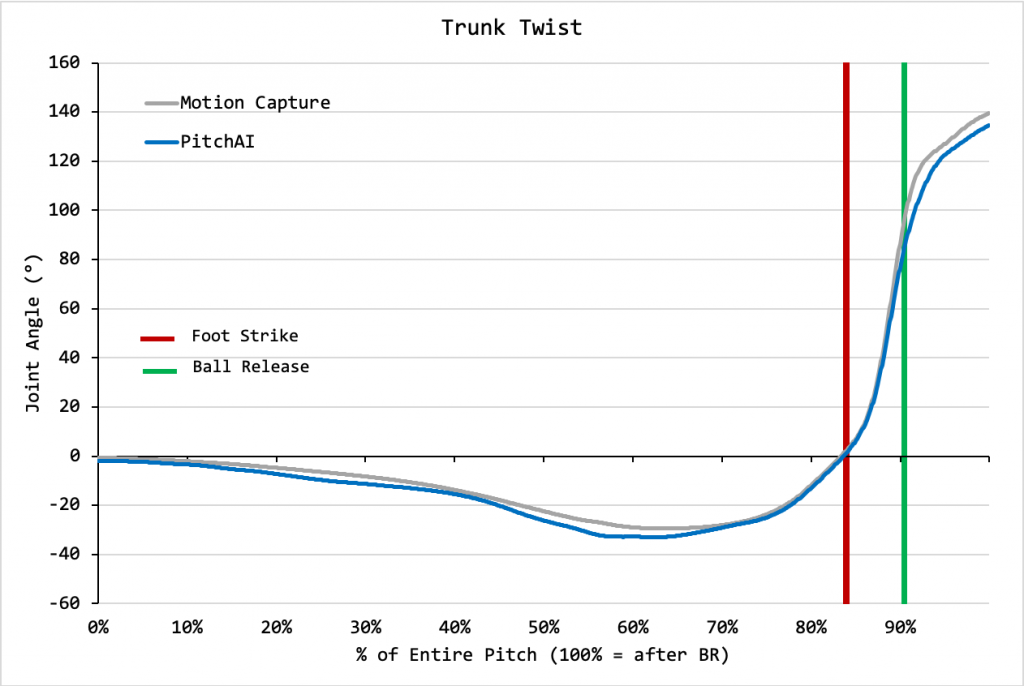
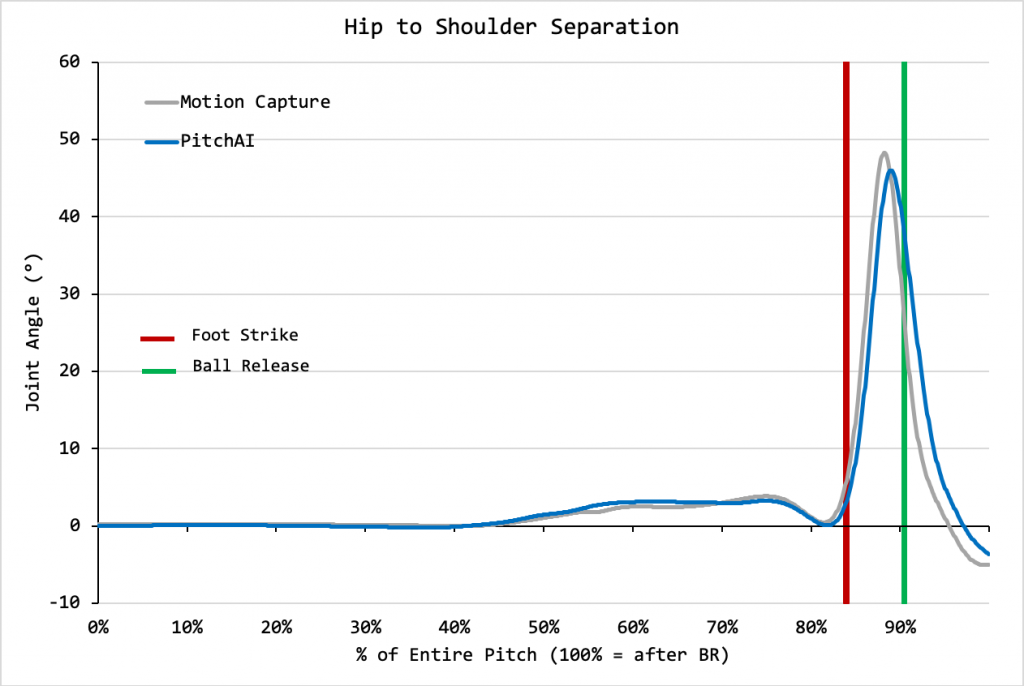
Statistically, we used a correlation on the full signal analysis between the motion capture system and PitchAI, as well as error % – which represented the error as a factor of the full range of motion exhibited by each pitcher.
Here are a few examples – take a look at external rotation of the throwing arm:
And, Trunk Twist.
And finally, hip to shoulder separation
In summary, take a look at the averages for the throwing arm, glove arm, trunk, and knee metrics for both correlation and error.
| Throwing Arm | Glove Arm | Legs | Trunk | Average | |
| r2 | 0.94 | 0.87 | 0.98 | 0.97 | 0.89 |
| Error | 10% | 18% | 14% | 4% | 12% |
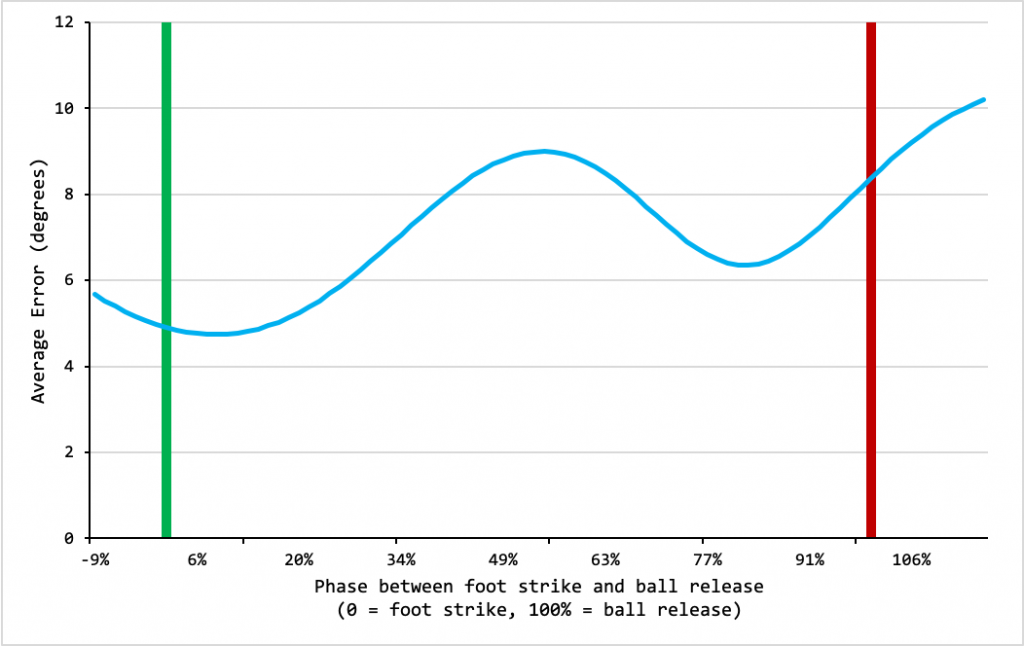
Where the meat of the analysis is being performed (between foot strike and ball release), the average error across all 15 of our metrics, is less than 10 degrees.
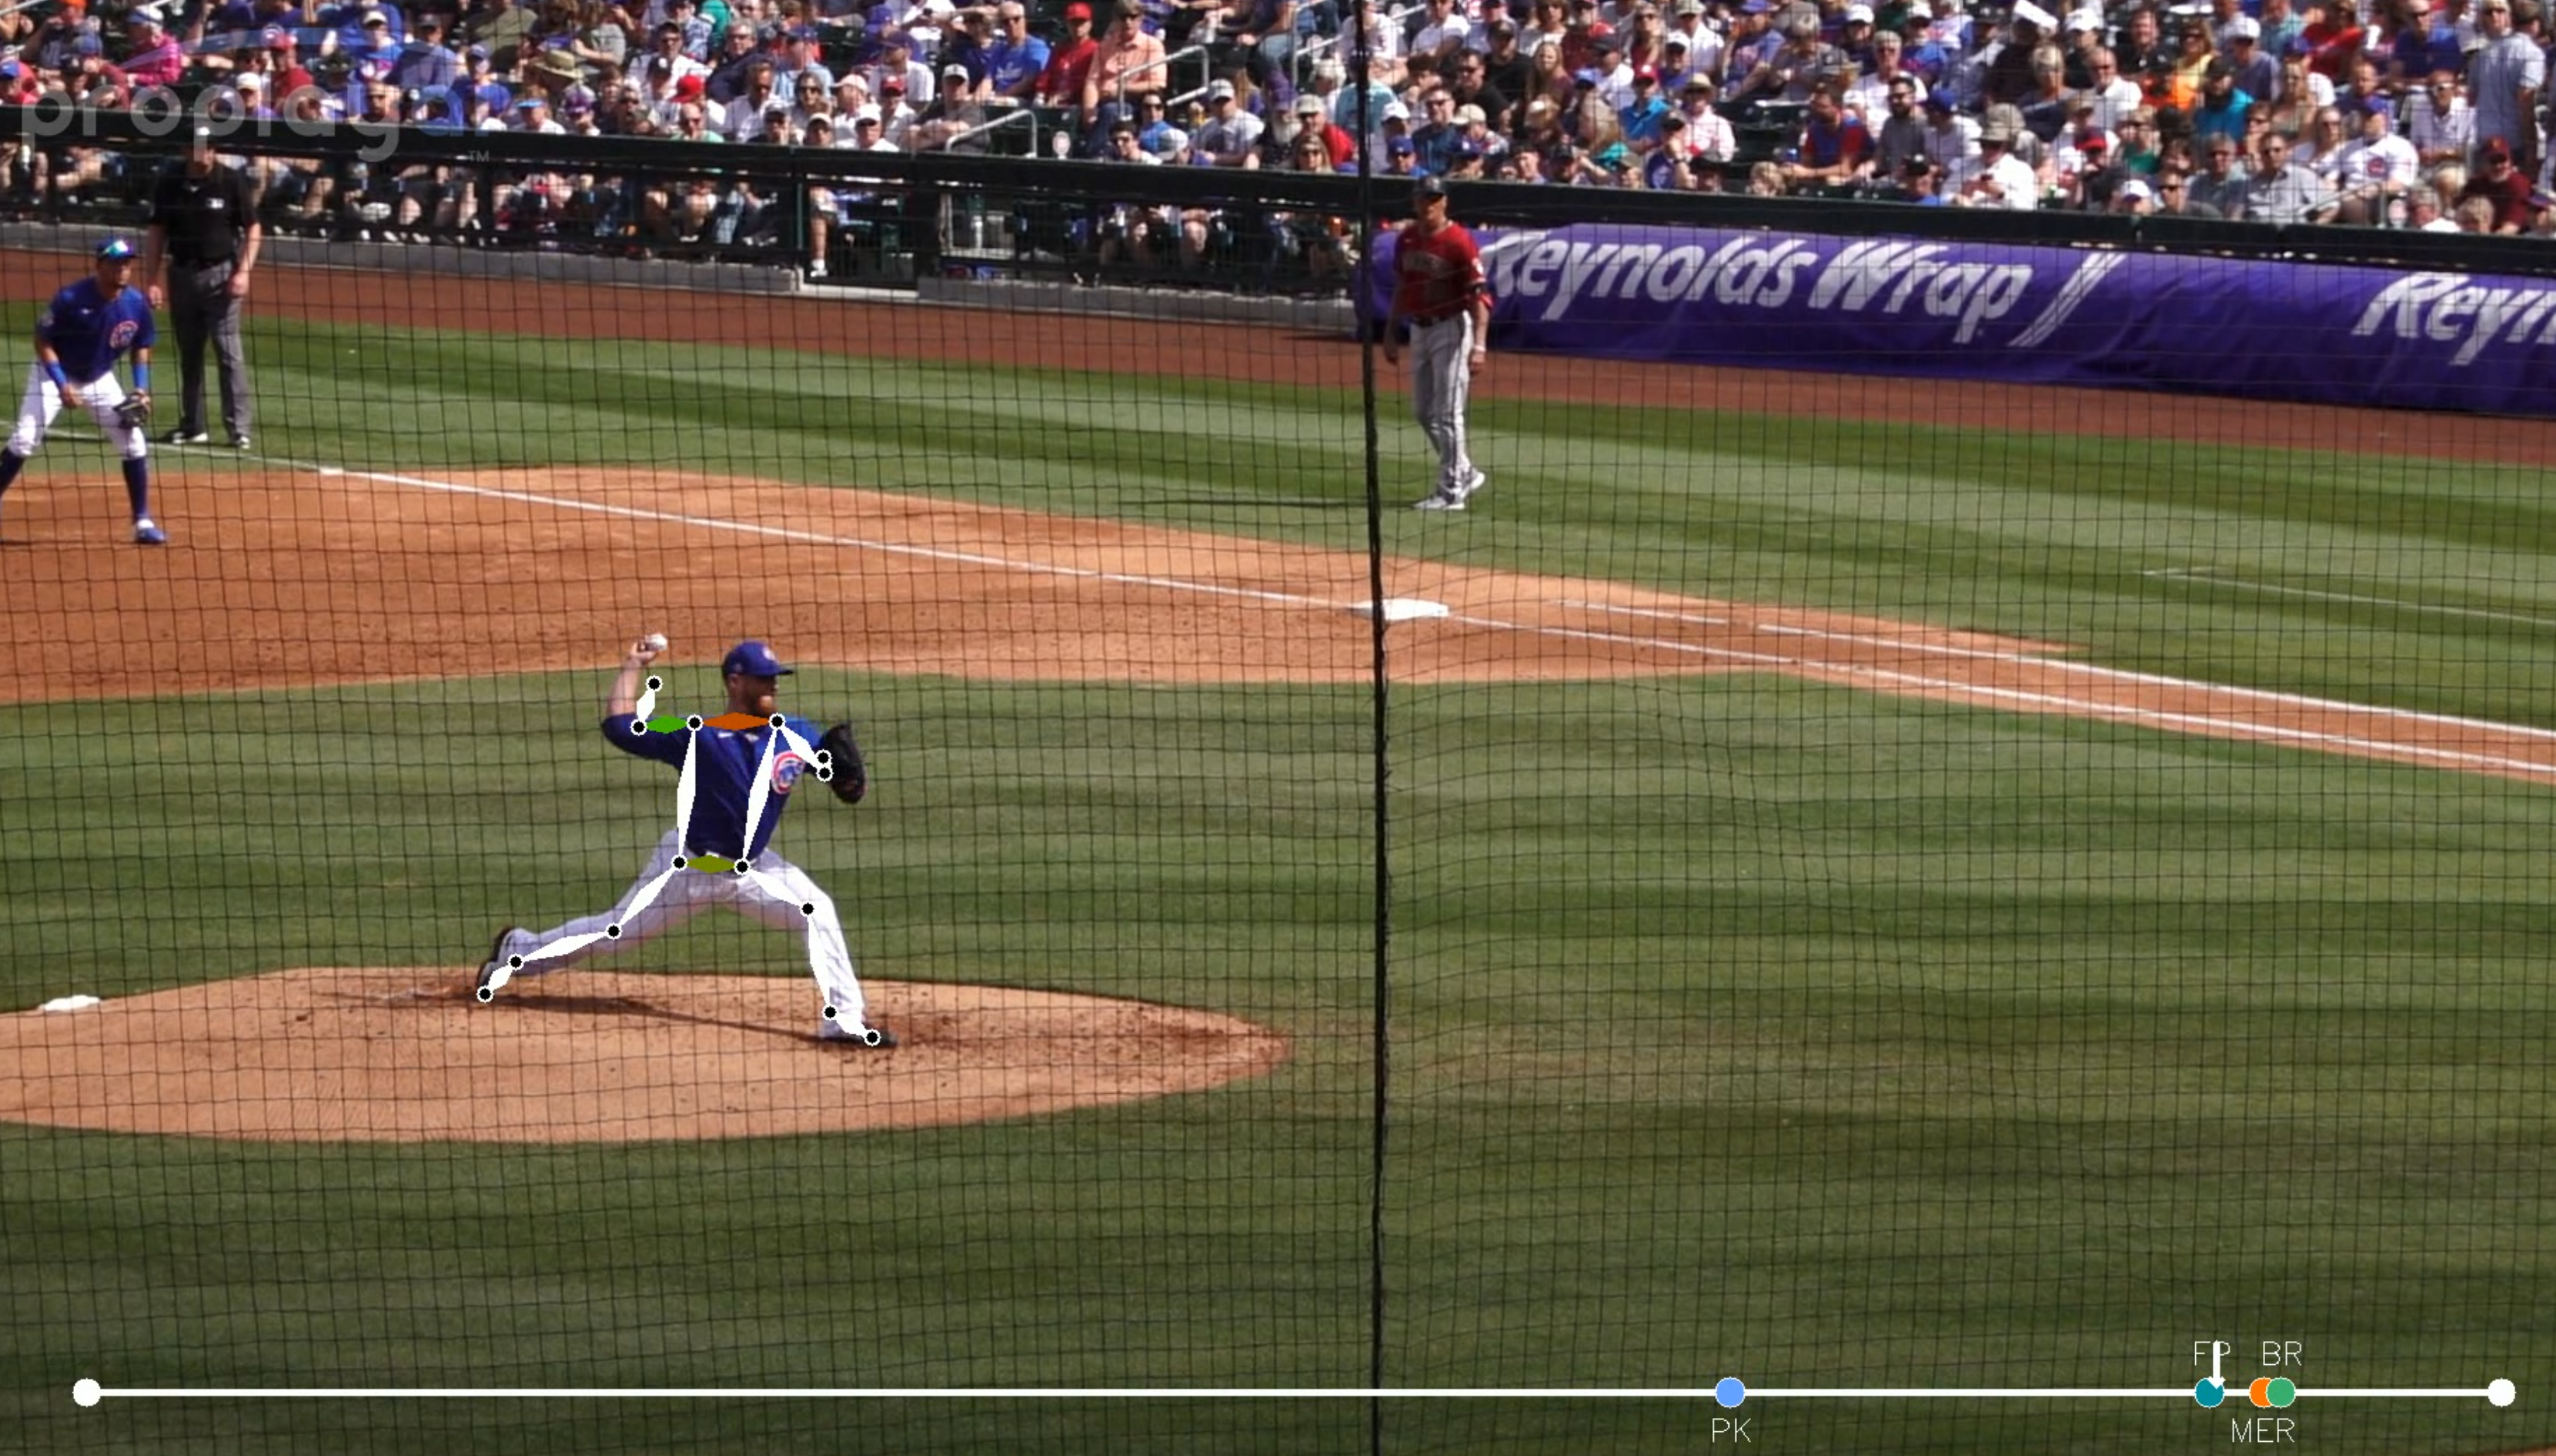
The easiest way to see what is happening from PitchAI is this video – the blue lines are the motion capture system. The white lines are from our single camera iPhone capture.
The number that sticks out the most – on average, 12% error. 12% error across all pitchers (and we included pros, college, and high school arms in this validation). Instead of needing to go into a motion capture lab to get an accurate biomechanics assessment – you can just pitch. This is Corey Kluber pitching in a game back in March – now complete with a biomechanics assessment.
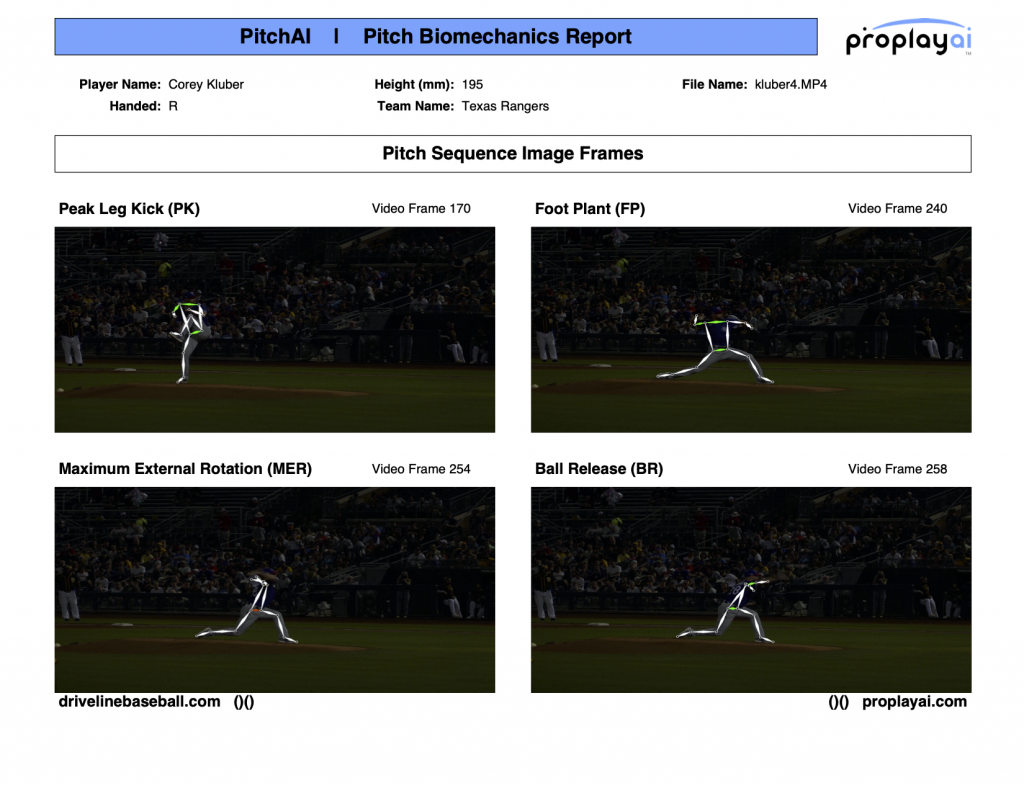
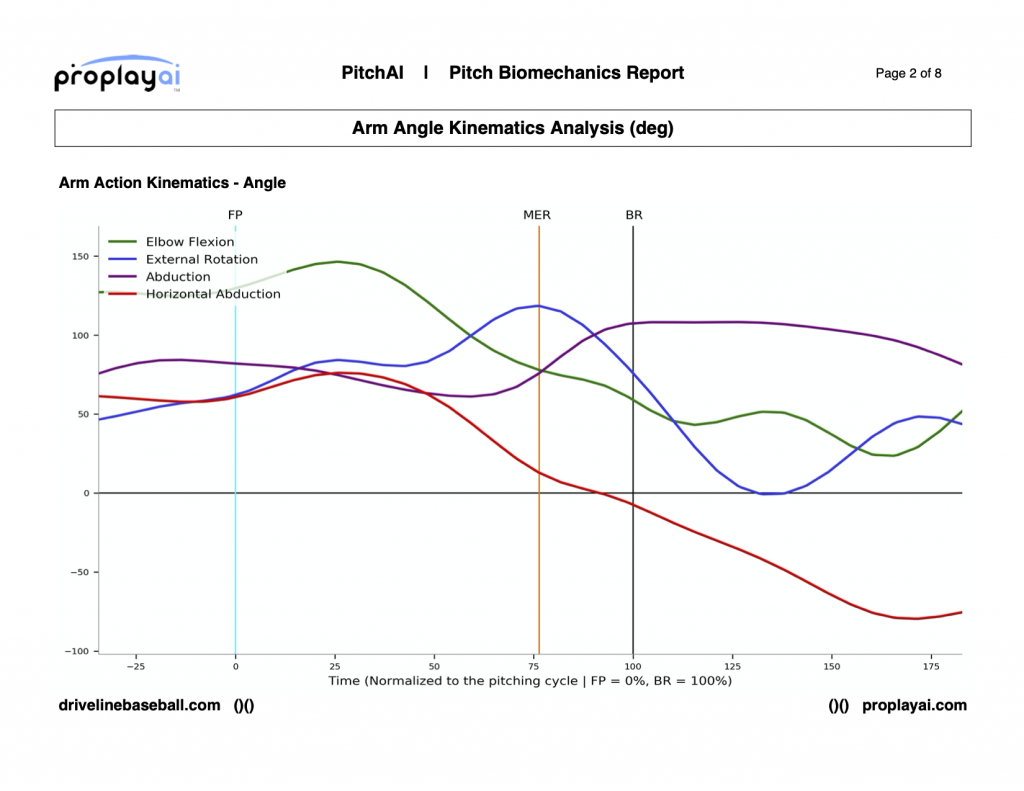
It is now that easy to get a biomechanics assessment done – at any time, on any player. That ergonomics model for understanding player performance and injury risk? Just wait for the data to roll in. With a great research team consisting of Dr. Colin McKinnon, Ryan Bench, Dr. Mike Holmes, and the Biomechanics team at Driveline Baseball (including Anthony Brady and Kyle Boddy), we can’t wait to share what we’re working on next.
PitchAI is set to launch in August – but will be available first through Driveline TRAQ. Follow us closely – we can’t wait to make biomechanics a part of your every day training.

