Authors: Mike Sonne and Lennon Richards
Baseball is implementing a ban on sticky substances, those designed to give pitchers a better grip on the ball, but also to increase the spin rate on their pitches. This boost in spin rate makes it harder for hitters to do their job – with pitches moving more than they should and ending up in a different spot than the brain would expect it to be. However, this ban on things like sunscreen, pine tar, and spider tack may have unintended consequences when it comes to pitchers injuries. Using all of the tools at our disposal, we looked at how this ban on sticky stuff could impact pitcher performance and health.
Methods:
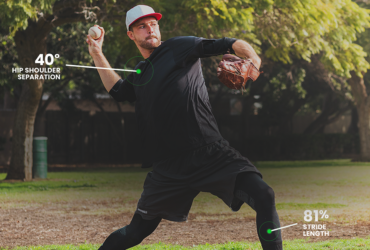
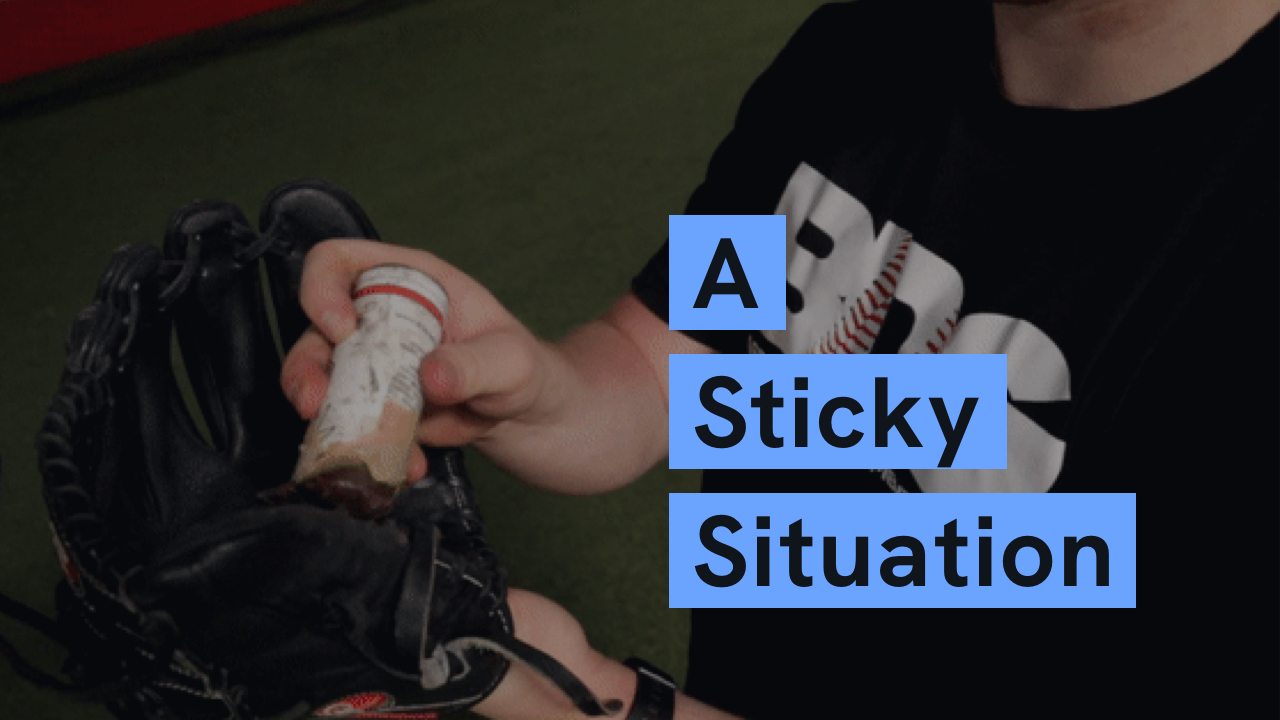
Lennon Richards and Tyler Dobos from Baseball Development Group once again donated their arms to science. For this case study we had them throw 5 pitches without any “sticky stuff” and 5 with Tiger Stick pine tar (applied to the glove first) – repeated twice. During this we utilized Rapsodo to collect ball flight metrics to measure the effects of “sticky stuff” on spin rates and velocity, all while using PitchAI to capture biomechanics on every throw.
Results:
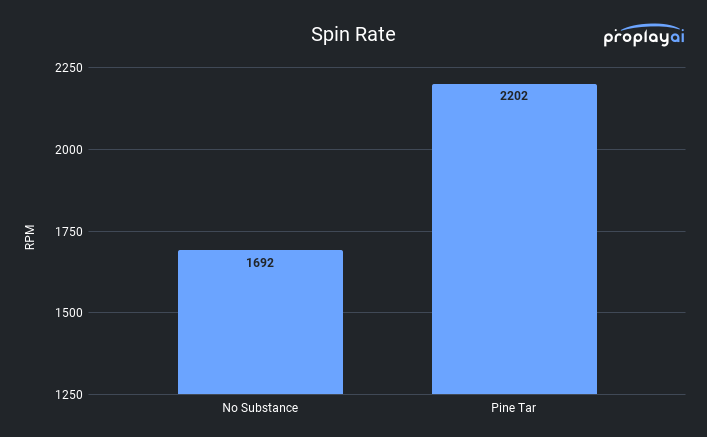
As expected, the spin rates reported with the use of pine tar (2202 rpm) are dramatically higher than without any substance (1692 rpm).
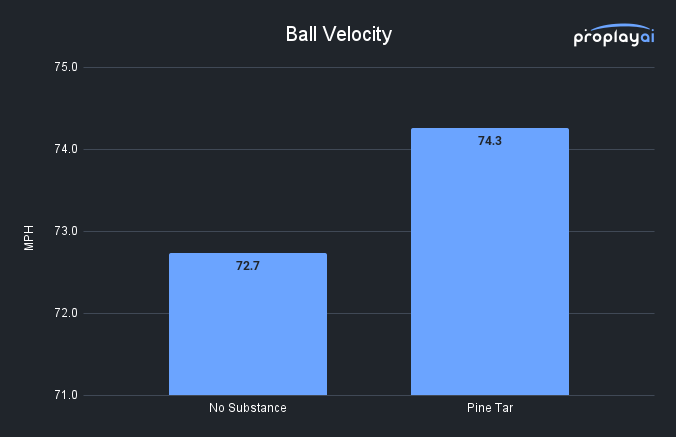
Interestingly, we also saw velocity to increase slightly from 72.7 mph without a substance to 74.3 mph with pine tar. A possible explanation for this rise in velocity is simply comfort. The added “stickiness” allows each athlete to worry less about the ball slipping out of their hand and instead focus on pitch execution at as high of RPE (rate of perceived exertion) as possible. For example, without any sticky stuff applied Lennon routinely sailed balls arm side – maybe a condition of less grip or just simply poor throws on his part. With pine tar added and more confidence in his grip this became less of an issue. Though minor, this psychological element alone could be enough to see velocity increase.
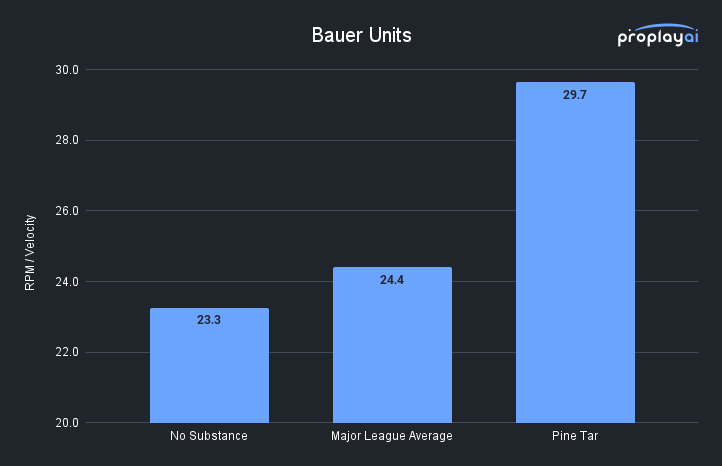
When we calculate Bauer Units (or velocity normalized spin) (total spin / velocity) to account for this velocity differential we’re left with 23.3 BU with no substance, a touch below the major league average of 24.4 BU from a quick scan of Baseball Savant, compared to 29.6 BU which would be amongst the league leaders in normalized spin.
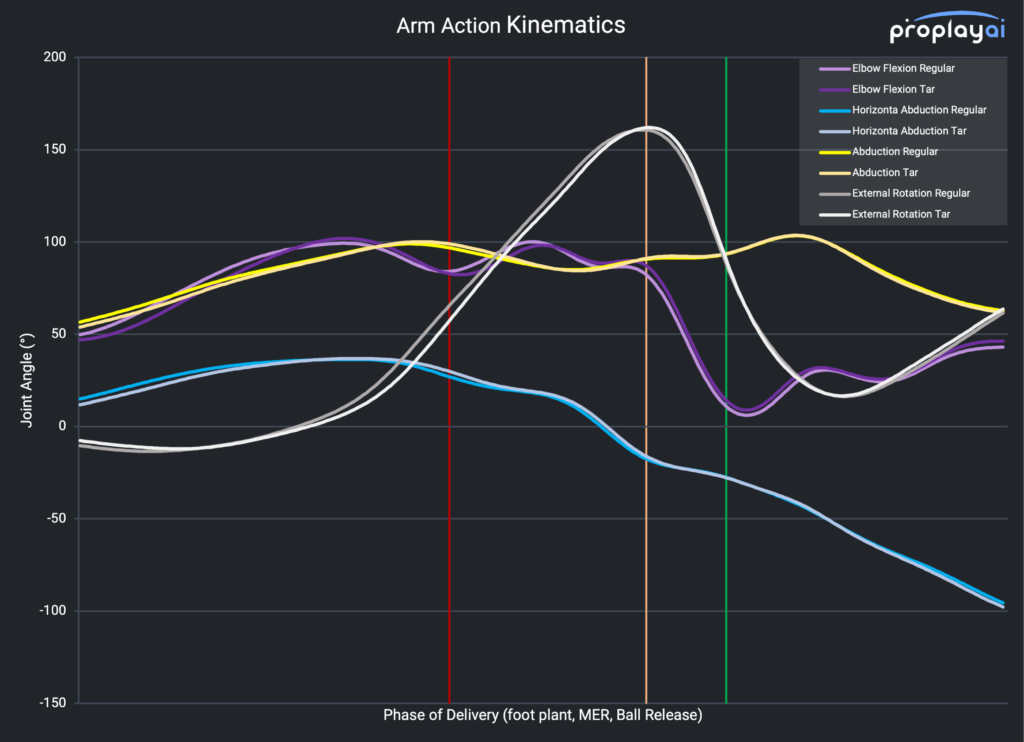
Looking at the mechanics, nothing really changed between the regular and pine tar conditions – and truthfully, this is to be expected.
PitchAI looks at how the body moves throughout the pitch, and predicts the total amount of stress that would be on the elbow without knowing how muscle activations could protect the elbow. There’s no reason to believe that a pitcher’s mechanics would change because they were putting a sticky substance on their fingers.
Health Implications Through Muscle Activation Patterns
Where the health implications come in are with the way those muscles activate to protect the ligaments of the elbow. A large group of muscles in the forearm, close to the inside of the elbow (called the Flexor Pronator Mass) contract forcefully during the pitching delivery to protect the ulnar collateral ligament (the UCL). If those muscles didn’t exist, the force passed through that ligament would cause a tear on almost every single pitch thrown, according to cadaver studies.
The need for this muscle to contract to protect the elbow is why issues like muscle fatigue have been found to be the biggest risk factor for elbow injuries and Tommy John surgery. Pitchers that throw while fatigued are up to 36 times more likely to have elbow surgery. This was the basis for the workload metric “Fatigue Units”, which modelled the cumulative force lost by these muscles throughout the course of a season, as a response to pitches thrown, days of rest, and pitching velocity.
Tyler Glasnow’s comments recently about “choking the ball” without the use of rosin or other sticky aids should really be of grave concern to Major League Baseball. If pitchers are having to grip the ball harder, we will see them increase their muscle activation, and incur more fatigue on any given outing.
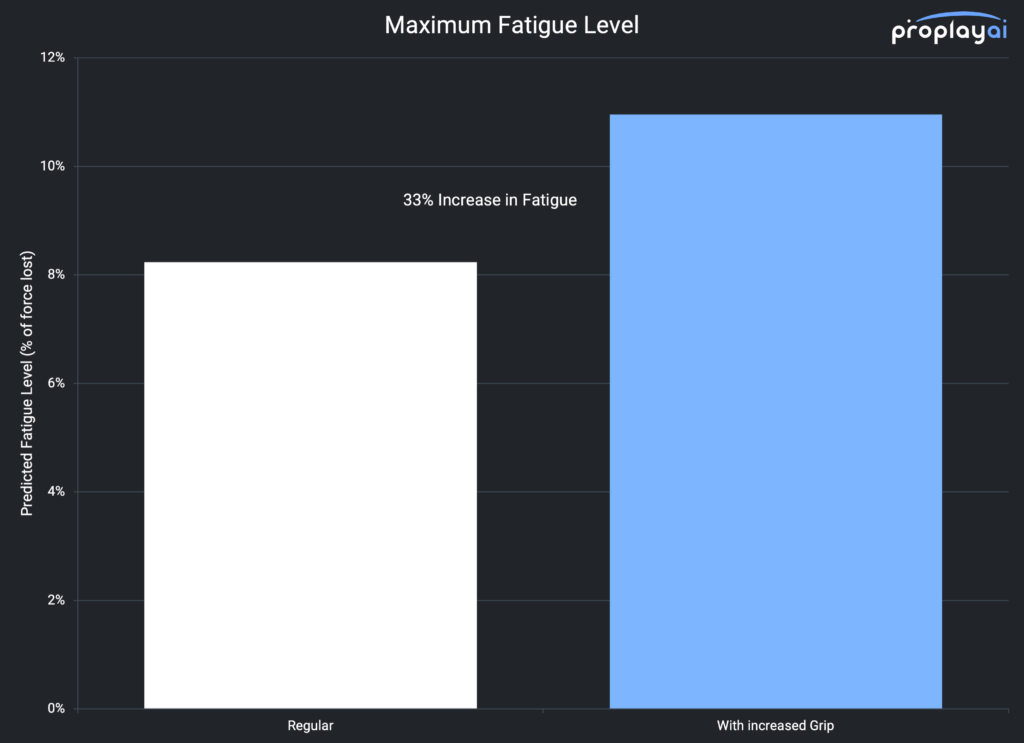
To check out the impact of increasing how much grip is required to spin the ball, Iwe ran a simulation using a fatigue model – the same one used to show that putting in a pitch clock would increase fatigue levels by reducing the amount of rest a pitcher had. Assuming that the lack of grip could cause a 15% increase in how much force the pitcher had to generate, we analyzed the fatigue levels from a really good pitcher – Max Scherzer, during his no hitter in 2015.
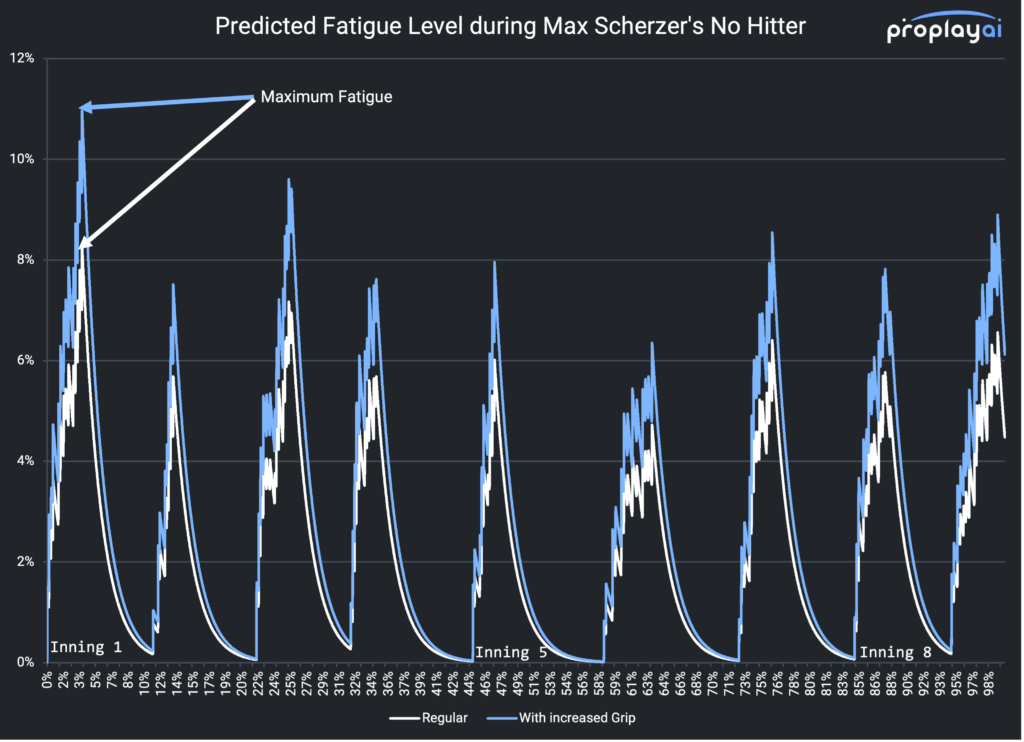
In this graph, you can see how much muscle force Max would have lost pitching normally (in grey). Now assuming he’d have to increase his grip force by 15% to get a better handle on the ball, you can see how much more force he’d lose due to fatigue in blue. In fact, the peak fatigue in his forearm goes up from around 8% to nearly 11% – a 33% increase in fatigue levels.
It’s been cited that pitchers are using sticky stuff to get a good grip on the ball and improve their control – at the same time, some pitchers seem to be taking this to the extreme to turn themselves into near super human performers. Back in 2015 and 2016 when there was a distinct change in the ball, there was a surge in blisters (you can see in this Eno Sarris article from 2017 what that looked like). This was in response to pitchers needing to apply more force to get the same results that they were used to (and, to keep the ball in the park). With the change in rules this time around, it’s not unreasonable to see another surge in blisters, but it could get much worse than that – and Tyler Glasnow’s latest injury woes might be a glimpse into what it might look like.